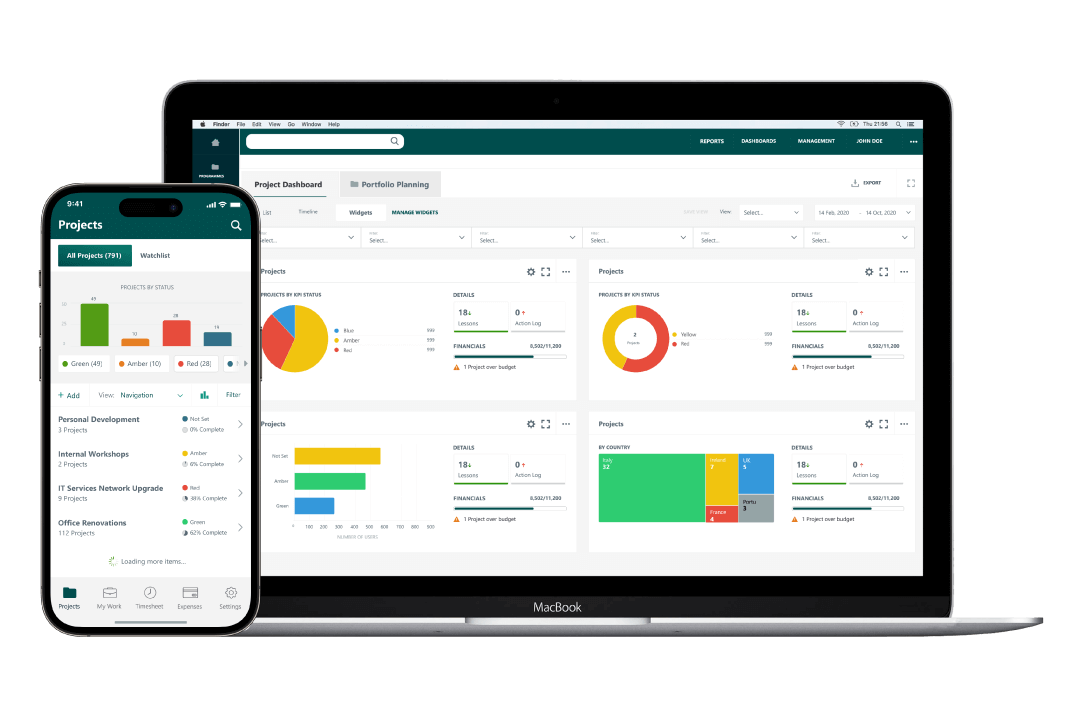

Project Management Offices face a critical challenge: transforming vast amounts of project data into actionable insights that drive portfolio decisions. While 89% of large organizations have adopted project management offices, only 35% report having the analytical capabilities needed to optimize portfolio performance effectively.
Business intelligence (BI) has emerged as the solution, providing PMO leaders with the technological infrastructure to convert raw project data into strategic insights that improve portfolio ROI, reduce project failure rates, and align execution with business strategy. Artificial intelligence now extends what a project report can do, moving it from a record of last month to an early warning about next quarter.
"Organizations that deploy AI as a reporting tool will realize limited benefits; while organizations that redesign portfolio decision making around AI-driven risk intelligence will gain a sustained decision advantage."
-Gartner, How to Use AI to Improve Portfolio Risk Management and Protect Value, June 2026
Key Takeaways
Project reporting turns scattered project data into a single project overview that PMO leaders, executives, and stakeholders can use to make portfolio decisions.
Gartner 2026 research shows AI moves project reporting from periodic status reports to continuous risk sensing that combines internal delivery data with external signals.
Probabilistic forecasting replaces single-point estimates with confidence ranges, giving leaders a clearer view of schedule, cost, and benefit risks.
Data visualization, interactive reporting, and performance measurement remain the foundation that AI-powered project reporting depends on.
Clean data, clear governance, and hands-on AI skills for PMO teams decide whether AI reporting tools create value or simply produce more reports.
Custom reports let PMO analysts tailor reports to each audience, from a board-level portfolio summary to a sprint view for scrum teams. The goal is the same in every case: give each reader the one piece of information they need to make a decision.
A Project Status Report Keeps Stakeholders Aligned Across the Lifecycle
A project status report is the most common project report, and it works best when it is short, consistent, and tied to decisions. Each status report should cover project progress against plan, key risks and issues, upcoming milestones, and the decisions stakeholders need to make.
In agile project management, teams often replace long written reports with burndown charts and sprint reviews, while stage-gated product development programs rely on milestone and earned value tracking. Enterprise PMOs usually need both views across the full project lifecycle, which is where project management software with built-in reporting tools earns its place.
AI Moves Project Reporting From Hindsight to Foresight
Gartner June 2026 research, How to Use AI to Improve Portfolio Risk Management and Protect Value, argues that periodic reviews and static risk registers can no longer keep pace with how fast portfolio risk emerges. Traditional project reporting relies on scheduled cycles and subjective assessment, which leaves blind spots between one status report and the next.
The report draws a clear line for PMO leaders. Organizations that use AI to produce the same reports faster will see limited gains, while organizations that redesign portfolio decisions around AI-driven risk intelligence gain a lasting decision advantage.
Gartner AI Use-Case Assessment for Program and Portfolio Management Processes (July 2026) finds that most current AI deployments center on project manager tasks such as documentation curation, status reporting, and knowledge management. Status reporting is where many PMOs start with AI, but it should not be where they stop.
Continuous Risk Sensing Replaces Periodic Status Report Cycles
Continuous risk sensing uses AI to analyze changing conditions between formal reviews. It takes in structured data, such as schedules, budgets, and resource utilization, alongside unstructured information like risk narratives and meeting notes.
Natural language processing can pick up recurring concerns, sentiment shifts, and emerging risk themes that a monthly status report would miss. When teams add external signals such as regulatory changes, geopolitical events, or supply chain disruption, the PMO gains context that internal reports cannot provide on their own.
Automated data pipelines refresh portfolio information without waiting for the next reporting cycle, and alerts fire when leading indicators point to rising risk. Cora's article on continuous risk sensing for PMOs explains how teams put this into practice.
Probabilistic Forecasting Replaces Single-Point Estimates
Many project reports still forecast a single completion date, which hides the uncertainty behind it. Gartner recommends confidence-based outcome ranges instead, so leaders can see the likelihood of finishing an initiative within different timeframes.
Monte Carlo-style simulation models many delivery scenarios and shows how interconnected risks could spread across projects. Learn more in Cora's guide to probabilistic project forecasting.
AI Insights Belong Inside Portfolio Reviews
Gartner stresses that risk intelligence should inform decisions, not replace them. PMOs get the most value when AI-generated insights feed directly into portfolio reviews and teams rank initiatives by risk-adjusted value instead of business cases alone.
The research also flags cautions worth planning for, including false precision when model assumptions stay hidden and misleading insights from poor-quality data. See how AI-powered project risk intelligence strengthens a portfolio risk dashboard while keeping assumptions visible.
AI Agents Need Clean Data and Governance Before They Report
A recent Gartner article on AI agents for PMO decisions notes that the gap between generative and agentic AI is
"almost always a data and integration problem."
(Gartner, "Build Effective PPM AI Agents to Improve PMO Decisions & Capacity," Peter Clegg, Aditi Pant, et al., 21 July 2026, ID G00855505).
An agent that drafts a project status report or recommends reprioritization is only as reliable as the project data underneath it.
Governance matters just as much. Another Gartner article 'Strengthen AI Governance to Manage Agentic AI Risks' (July 2026) states,
"AI agents cannot be accountable entities,"
(Gartner, "Strengthen AI Governance to Manage Agentic AI Risks" Stuart Strome, James Crocker, 08 July 2026, ID G00851162).
so a named person still owns every decision a project report informs.
Data Visualization Bridges Complex Project Data and Human Understanding
Among the parts of BI, data visualization has the most immediate impact for users across an organization. When implemented well, visualization tools help decision-makers spot trends, patterns, and outliers that stay hidden in spreadsheets or databases.
Organizations that use advanced data visualization techniques make faster, better-informed decisions. A well-designed chart can tell stakeholders in seconds what a 20-page project report takes an hour to explain.
Information Radiators Extend Project Reports Beyond Traditional Dashboards
Modern project BI extends beyond traditional dashboards to embrace PMBOK's concept of information radiators—physical or digital displays that provide immediate, actionable insights:
- Portfolio Kanban Boards: Visualize project flow through stages with WIP limits
- Burn Charts at Portfolio Level: Track value delivery across all projects
- Risk Heat Maps: Show risk concentration across your portfolio
- Earned Value Trend Analysis: Integrate SPI/CPI trends with predictive forecasting
TT Electronics exemplifies this approach, using visual controls that allow executives to instantly see project health across their entire portfolio.
Data Storytelling: Narrative Through Numbers
Data storytelling represents the narrative approach to business intelligence in project management, combining visualization techniques with contextual information to create compelling narratives that drive action. According to Harvard Business Review (2023), this approach recognizes that project data alone, even when beautifully presented, may not inspire necessary insights without proper framing. Effective storytelling begins with understanding the audience—executive leadership may need high-level portfolio trends, while project managers might require granular metrics specific to their initiatives. Project portfolio management solutions that support customized views enable more effective storytelling across organizational levels.
The narrative structure typically follows a logical progression: context establishes the project situation, discovery presents insights through progressive disclosure, significance explains why these insights matter to a company, and recommendations suggest specific actions based on the data narrative, as outlined by Tableau (2024).
"Effective data storytelling combines visualization techniques with contextual information to create a compelling narrative that drives project decisions and actions." - Harvard Business Review (2023)
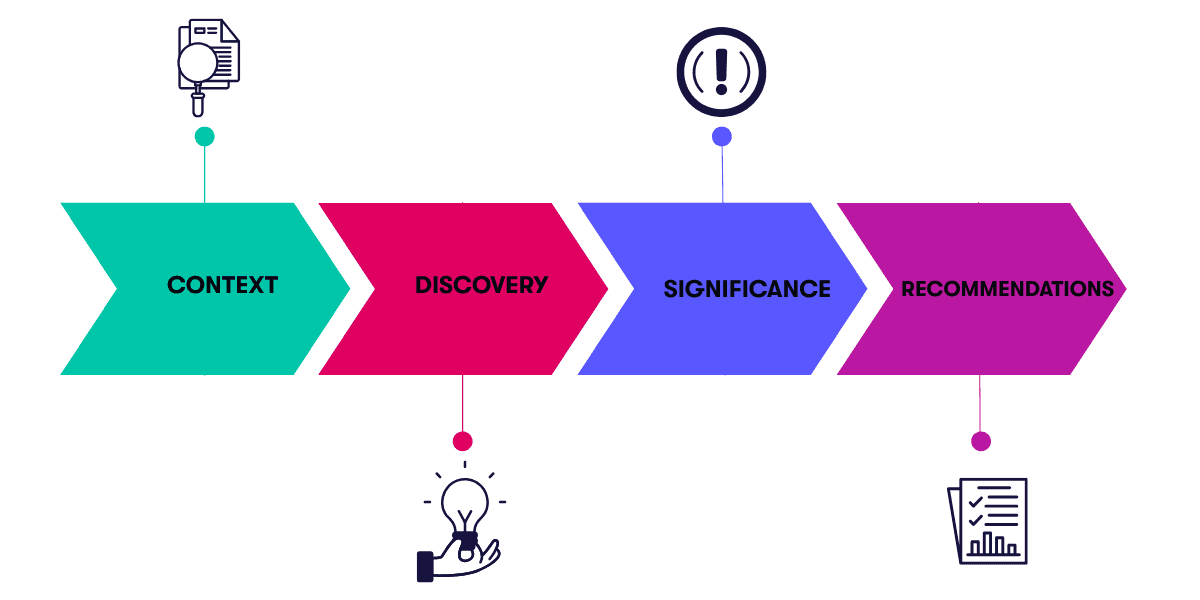
Chart Types Match Each Project Report to Its Audience
Choosing the right chart type shapes how clearly a project report communicates. As Tableau explains, different data relationships call for specific visual representations, and Gantt charts excel at displaying schedules and dependencies while burndown charts reveal progress toward completion.
According to Microsoft Power BI, pie and donut charts display proportional relationships within a portfolio, though they work best with few categories and clear differences between segments. Treemaps handle more complex proportions across many projects, and scatter plots reveal correlations such as project duration against budget variance.
Heat maps use color intensity to show data density, which makes them useful for spotting resource bottlenecks, risk concentrations, and performance variations, as noted in Tableau's visualization guidelines (2024). The deciding factor for any chart is the story the data needs to tell and the audience who will read it.
Interactive Reporting Lets Stakeholders Explore Project Status in Seconds
Interactive reporting moves project BI from static presentations to dynamic, user-driven exploration. According to Gartner Magic Quadrant for Analytics and Business Intelligence Platforms (2024), modern project management tools let users filter, drill down, and reconfigure visualizations in real time without technical expertise.
When stakeholders can explore project data on their own, organizations reduce analytical bottlenecks and speed up decision cycles. That independence encourages a more data-driven culture throughout the project management office.
Forrester Research (2024) identifies cross-filtering and drill-down as core interactive features in modern project business intelligence platforms. Parameter controls let managers adjust time periods, thresholds, or calculation methods, which makes scenario analysis accessible to people without analytical backgrounds.
TT Electronics, a global electronics manufacturing company, improved its organizational reporting through advanced project portfolio management solutions. The company is saving 2,200 days annually on project management reporting while giving executives drill-down access to active, cancelled, and completed projects. As TT Electronics executives noted,
"our executives are able to get data quicker through inbuilt reporting,"
This example shows how interactive BI shortens the time between data collection and actionable insight. It also shows how advanced reporting supports both operational excellence and strategic visibility across complex project portfolios.
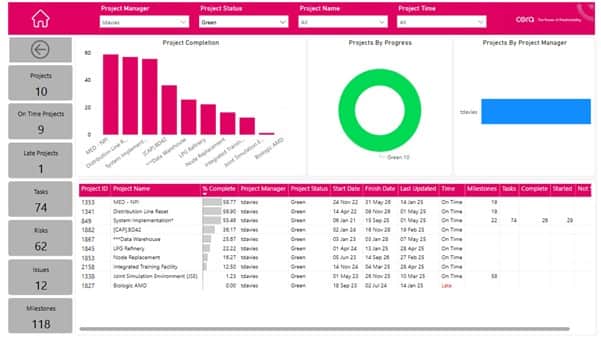
Example of a Portfolio View of a Cora PowerBI Report
Predictive Analytics: The Future of Business Intelligence in Project Management
The evolution of BI has transformed how project-driven organizations leverage data for strategic advantage. While traditional project reporting focused primarily on past performance, modern project portfolio management platforms increasingly incorporate predictive analytics capabilities that enable forward-looking insights.
According to Towards Data Science (2024), this shift from descriptive to predictive analytics represents one of the most significant developments in the project management landscape.
"Predictive analytics transforms project business intelligence from a retrospective tool into a strategic asset that supports proactive decision-making across all project phases and operational areas." - Forrester Research (2024)
Machine Learning Algorithms in Project Management Applications
Machine learning algorithms sit at the core of predictive analytics, finding patterns too complex for human analysts to detect. As explained by KDnuggets (2024), these algorithms learn from historical project data and become more accurate as more information becomes available.
Built into project management tools, machine learning puts advanced analytics in the hands of project managers without data science expertise. For a closer look at how these technologies are changing business practices, Cora's project management podcast on machine learning features insights from industry experts.
Regression algorithms model relationships between project variables to predict outcomes. According to Towards Data Science, linear regression predicts continuous values like project duration or resource requirements, while logistic regression predicts binary outcomes such as project success probability or risk materialization likelihood.
Classification algorithms categorize projects into predefined groups based on characteristics, with decision trees creating flowchart-like models for project risk categorization and resource allocation recommendations, while random forests combine multiple trees to improve accuracy and reduce overfitting, as noted by KDnuggets .
Clustering algorithms identify natural groupings within project portfolios without predefined categories, with K-means clustering grouping similar projects based on proximity in multi-dimensional space, as explained by Towards Data Science .
Time series analysis algorithms address temporal dependencies by identifying seasonal patterns and cyclical behaviors in sequential project data, making them essential for resource forecasting and capacity planning, according to KDnuggets .
Data Mining Techniques for Extracting Valuable Project Patterns
While machine learning algorithms provide the analytical engine for predictive analytics, data mining techniques offer the methodological framework for extracting actionable insights from large project datasets. These techniques combine statistical analysis, pattern recognition, and domain expertise to discover meaningful relationships within project data.
Association rule mining identifies relationships between variables in large datasets, revealing which project elements or events frequently occur together—powering risk factor analysis and helping identify process bottlenecks and resource dependencies across various project operations.
Sequence pattern mining extends association analysis to incorporate temporal ordering, identifying common sequences of events or transactions in project lifecycles. According to Towards Data Science , this technique proves particularly valuable for analyzing project workflows, change request patterns, and failure modes, allowing organizations to optimize processes and implement preventive measures.
Anomaly detection identifies outliers or unusual patterns that deviate from expected project behavior, helping detect scope creep, budget anomalies, and quality issues before they cause significant damage to project outcomes.
Text mining extracts meaningful information from unstructured project text data, including status reports, issue logs, and stakeholder communications. As described by KDnuggets , natural language processing techniques transform this unstructured text into structured data that can be analyzed alongside traditional project metrics, enabling organizations to incorporate valuable qualitative insights into their quantitative project intelligence frameworks.
Forecasting Methods Help Teams Plan Resources and Schedules
Forecasting is one of the most valuable uses of predictive analytics in project BI. According to Towards Data Science, time series methods such as moving averages and exponential smoothing project future values from historical data, while ARIMA models capture trends and seasonality for more accurate forecasts.
Honeywell, a global engineering and technology company with over $30 billion in annual revenue, shows the impact of predictive forecasting in practice. As Jeff Hopkins, Vice President of Project Solutions at Honeywell, explains:
"We've improved our working capital by roughly half $1 billion over the past year or so. As project schedules evolve, we can see how billing milestones are moving on Cora. We can identify areas where we may be at risk of missing a billing milestone and then take the appropriate action to mitigate that risk, Cora gives us the superpower to look into the future."
This ability to anticipate issues before they materialize allows proactive intervention instead of reactive problem-solving. It is the practical version of the shift from hindsight to foresight that Gartner describes.
Causal forecasting methods add external variables that influence project outcomes. As explained by Forrester Research, multiple regression can forecast completion dates using team composition, stakeholder engagement, and external conditions alongside historical performance.
For aerospace and defense programs, Cora's insights on transforming scheduling management show how these techniques apply to complex projects. According to KDnuggets, simulation-based and machine learning-based forecasting, including neural networks and gradient boosting, help organizations understand the full range of possible outcomes.
Risk Assessment Tools and Scenario Analysis Test Project Resilience
Predictive analytics also evaluates potential risks and alternative scenarios so organizations can prepare for different contingencies. As noted by Forrester Research, risk scoring models use historical data to rate the probability and impact of schedule delays, budget overruns, and quality issues across a portfolio.
Sensitivity analysis shows how changes in individual inputs affect predicted project outcomes. According to Towards Data Science, it helps organizations focus mitigation on the most influential factors.
Scenario analysis evaluates best-case, worst-case, and most-likely futures based on different assumptions about key project variables.
Stress testing runs predictive models under extreme but plausible conditions to reveal hidden vulnerabilities, an approach Gartner notes has expanded into project management and resource planning. John McGrath's Masterclass on Predictive Analytics and Predictive Project Analytics explains how these techniques drive successful project outcomes.
Performance Measurement Anchors Every Project Report
Data visualization communicates insight and predictive analytics forecasts outcomes, while performance measurement provides the framework for judging project and portfolio success. Systematic tracking of key metrics helps organizations find strengths, address weaknesses, and align project work with strategic objectives, as emphasized by the Balanced Scorecard Institute (2024).
Key Performance Indicators Track the Project Metrics That Matter
Key Performance Indicators (KPIs) are quantifiable measures that reflect a project's critical success factors. According to the Balanced Scorecard Institute, strategic KPIs measure progress toward long-term objectives and business value, while operational KPIs monitor day-to-day project activity.
Leading Indicators Warn of Portfolio Problems Early
- Resource allocation conflicts across projects (predicts future delays)
- Stakeholder engagement scores trending downward (predicts acceptance issues)
- Number of unresolved risks in the portfolio backlog
- Project team mood/morale tracking (as shown in PMBOK's mood charts)
Lagging Indicators Confirm Project Performance
- Schedule Performance Index (SPI) and Cost Performance Index (CPI)
- Feature completion rates vs. planned delivery
- Actual vs. planned resource utilization
- Benefits delivery compared to business case projections
SMART Metrics Make Project Reporting Tools More Useful
Following PMBOK's guidance, make sure the metrics in your project reporting tools are:
Specific: Instead of "project health," measure "percentage of milestones achieved within 5% of planned dates"
Meaningful: Tie every metric to your business case. If reducing time-to-market is your goal, measure cycle time, not just task completion
Achievable: Set thresholds based on your organization's maturity. A 95% on-time delivery might be unrealistic if you're currently at 60%
Relevant: For construction projects, measure RFI response time; for software projects, measure deployment frequency
Timely: Real-time SPI/CPI calculations enable intervention before projects fail, not post-mortem analysis
Performance Dashboards Support Data-Driven Decisions
Performance dashboards turn measurement frameworks into visual interfaces for day-to-day decisions. As described by Microsoft Power BI, these interactive displays update key project metrics in real time so managers can respond quickly to emerging issues.
Strategic dashboards give executives a high-level portfolio view, analytical dashboards support deeper exploration for PMO analysts, and operational dashboards help project managers and team leads monitor daily work. According to the Project Management Institute, data-driven decision making (DDDM) frameworks give teams a structured way to turn performance insight into action, with A/B testing offering a rigorous way to compare alternatives.
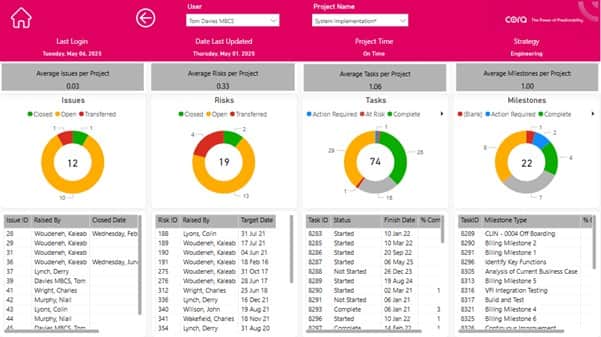
Example of a Project Manager Performance Report in Cora's PowerBI Dashboard
Common BI Pitfalls Undermine Project Reporting
Project management professionals must be aware of measurement pitfalls that weaken BI effectiveness:
The Hawthorne Effect in Project Metrics: When teams know they're being measured on specific KPIs, they may optimize for those metrics at the expense of project success. For example, measuring only on-time delivery might encourage teams to sacrifice quality or scope.
Vanity Metrics vs. Value Metrics: Tracking the number of projects in your portfolio is less valuable than measuring the percentage delivering expected business value. Focus on metrics that drive decisions, not just impressive numbers.
Correlation vs. Causation Errors: Just because projects over budget tend to be late doesn't mean budget overruns cause delays. Your BI platform should help identify root causes, not just correlations.
How Cora Systems Helps PMOs Create Project Reports With AI
Cora's project portfolio management software brings project tracking, financials, workforce planning, and risk into one integrated data model. That single source of truth gives PMOs the clean, connected data Gartner identifies as the prerequisite for any AI-enabled reporting.
Cora's business intelligence capabilities designed for project-intensive organizations include built-in Power BI reporting, so PMO analysts can customize colorful, dynamic graphical reports without exporting data to spreadsheets. Teams can tailor reports to fit your team's specific needs, from an executive portfolio overview to a detailed project status report for a single program.
Cora combines this reporting layer with earned value management, workforce planning, and strategic portfolio management in one platform. The Cora Assistant brings AI support into everyday project work, and Cora's approach to turning portfolio complexity into control reflects the same focus on decisions over data volume.
The results show in the numbers. TT Electronics saves 2,200 days a year on project management reporting, and Honeywell uses Cora forecasting to spot billing milestone risk early and protect working capital.
Conclusion: AI-Powered Project Reporting Protects Portfolio Value
The three pillars of business intelligence, data visualization, predictive analytics, and performance measurement, work together to turn raw project data into strategic advantage. As Harvard Business Review points out, organizations that excel in these areas understand past performance, predict future outcomes, and make data-driven decisions that support sustainable growth.
AI, machine learning, and natural language processing are becoming part of every project management platform, automating complex analysis and making BI accessible to people without technical backgrounds, according to Gartner.
Forrester Research notes that this broader access builds a more agile, responsive culture, and cloud-based solutions keep lowering implementation complexity and total cost of ownership.
Looking ahead, three trends will shape project reporting. First, AI-powered predictive capabilities will move from descriptive to prescriptive analytics that recommend specific actions.
Second, automation will take over data collection and routine reporting tasks so teams can focus on higher-value work. Third, digital twins and IoT will bring real-time monitoring to construction, manufacturing, and aerospace, where transforming scheduling management is already paying off.
Gartner 2026 report on AI-enabled portfolio risk management states plainly that organizations deploying AI purely as a dashboard tool will see limited returns. The advantage goes to organizations that redesign portfolio decision making around AI-driven risk intelligence. Cora gives PMOs the connected data, AI-ready analytics, and portfolio visibility to make that shift.
See how Cora turns project reporting into early warning and better portfolio decisions. Request a demo and our team will show you Cora's AI-powered reporting with scenarios built around your portfolio, or see Cora in action today.
This blog was reviewed by Francis Mc Nabola, Research Analyst at Cora Systems.